.svg)

In wealth management software, performance is critical. It’s the difference between a seamless client meeting and a moment of waiting for a dashboard to catch up. It’s what determines whether switching benchmarks feels instant or interrupted. And it becomes critical when firms consolidate portfolios across entities and expect analytics to scale without slowing down.
As portfolios grow in complexity and reporting requirements increase, the computational demands placed on systems increase with them. Faster analytics are not just a UX improvement. They are foundational to scalability, reliability, and trust.
Over the past development cycles, we have fundamentally reengineered our Metrics engine to significantly improve performance. By shifting from traditional loop-based calculations to vectorized processing, we have achieved 2-3x faster execution on large requests, with response times now consistently staying below 500 milliseconds.
Here is what changed and why it matters.
The Hidden Complexity Behind Portfolio Metrics
On the surface, performance metrics appear straightforward. Time-weighted return, drawdown, volatility, attribution, exposure, benchmarking. These are standard components of portfolio reporting.
Underneath, they are computationally intensive.
Each metric often requires:
- Processing long historical time series
- Combining multiple instruments across portfolios
- Applying mathematical transformations across thousands of data points
- Recalculating dynamically when users adjust filters or time horizons
The traditional way of implementing these calculations is sequential. You iterate over data points one by one:
- Fetch value at index 0
- Apply calculation
- Store result
- Move to index 1
- Repeat until the end of the series
Each datapoint is processed individually. As datasets grow, latency increases proportionally.
For smaller portfolios, this is acceptable. For larger portfolios, multi-entity reporting structures, or long-time horizons, this becomes a bottleneck.
We wanted to remove that bottleneck entirely.
From Sequential Loops to Vector Operations
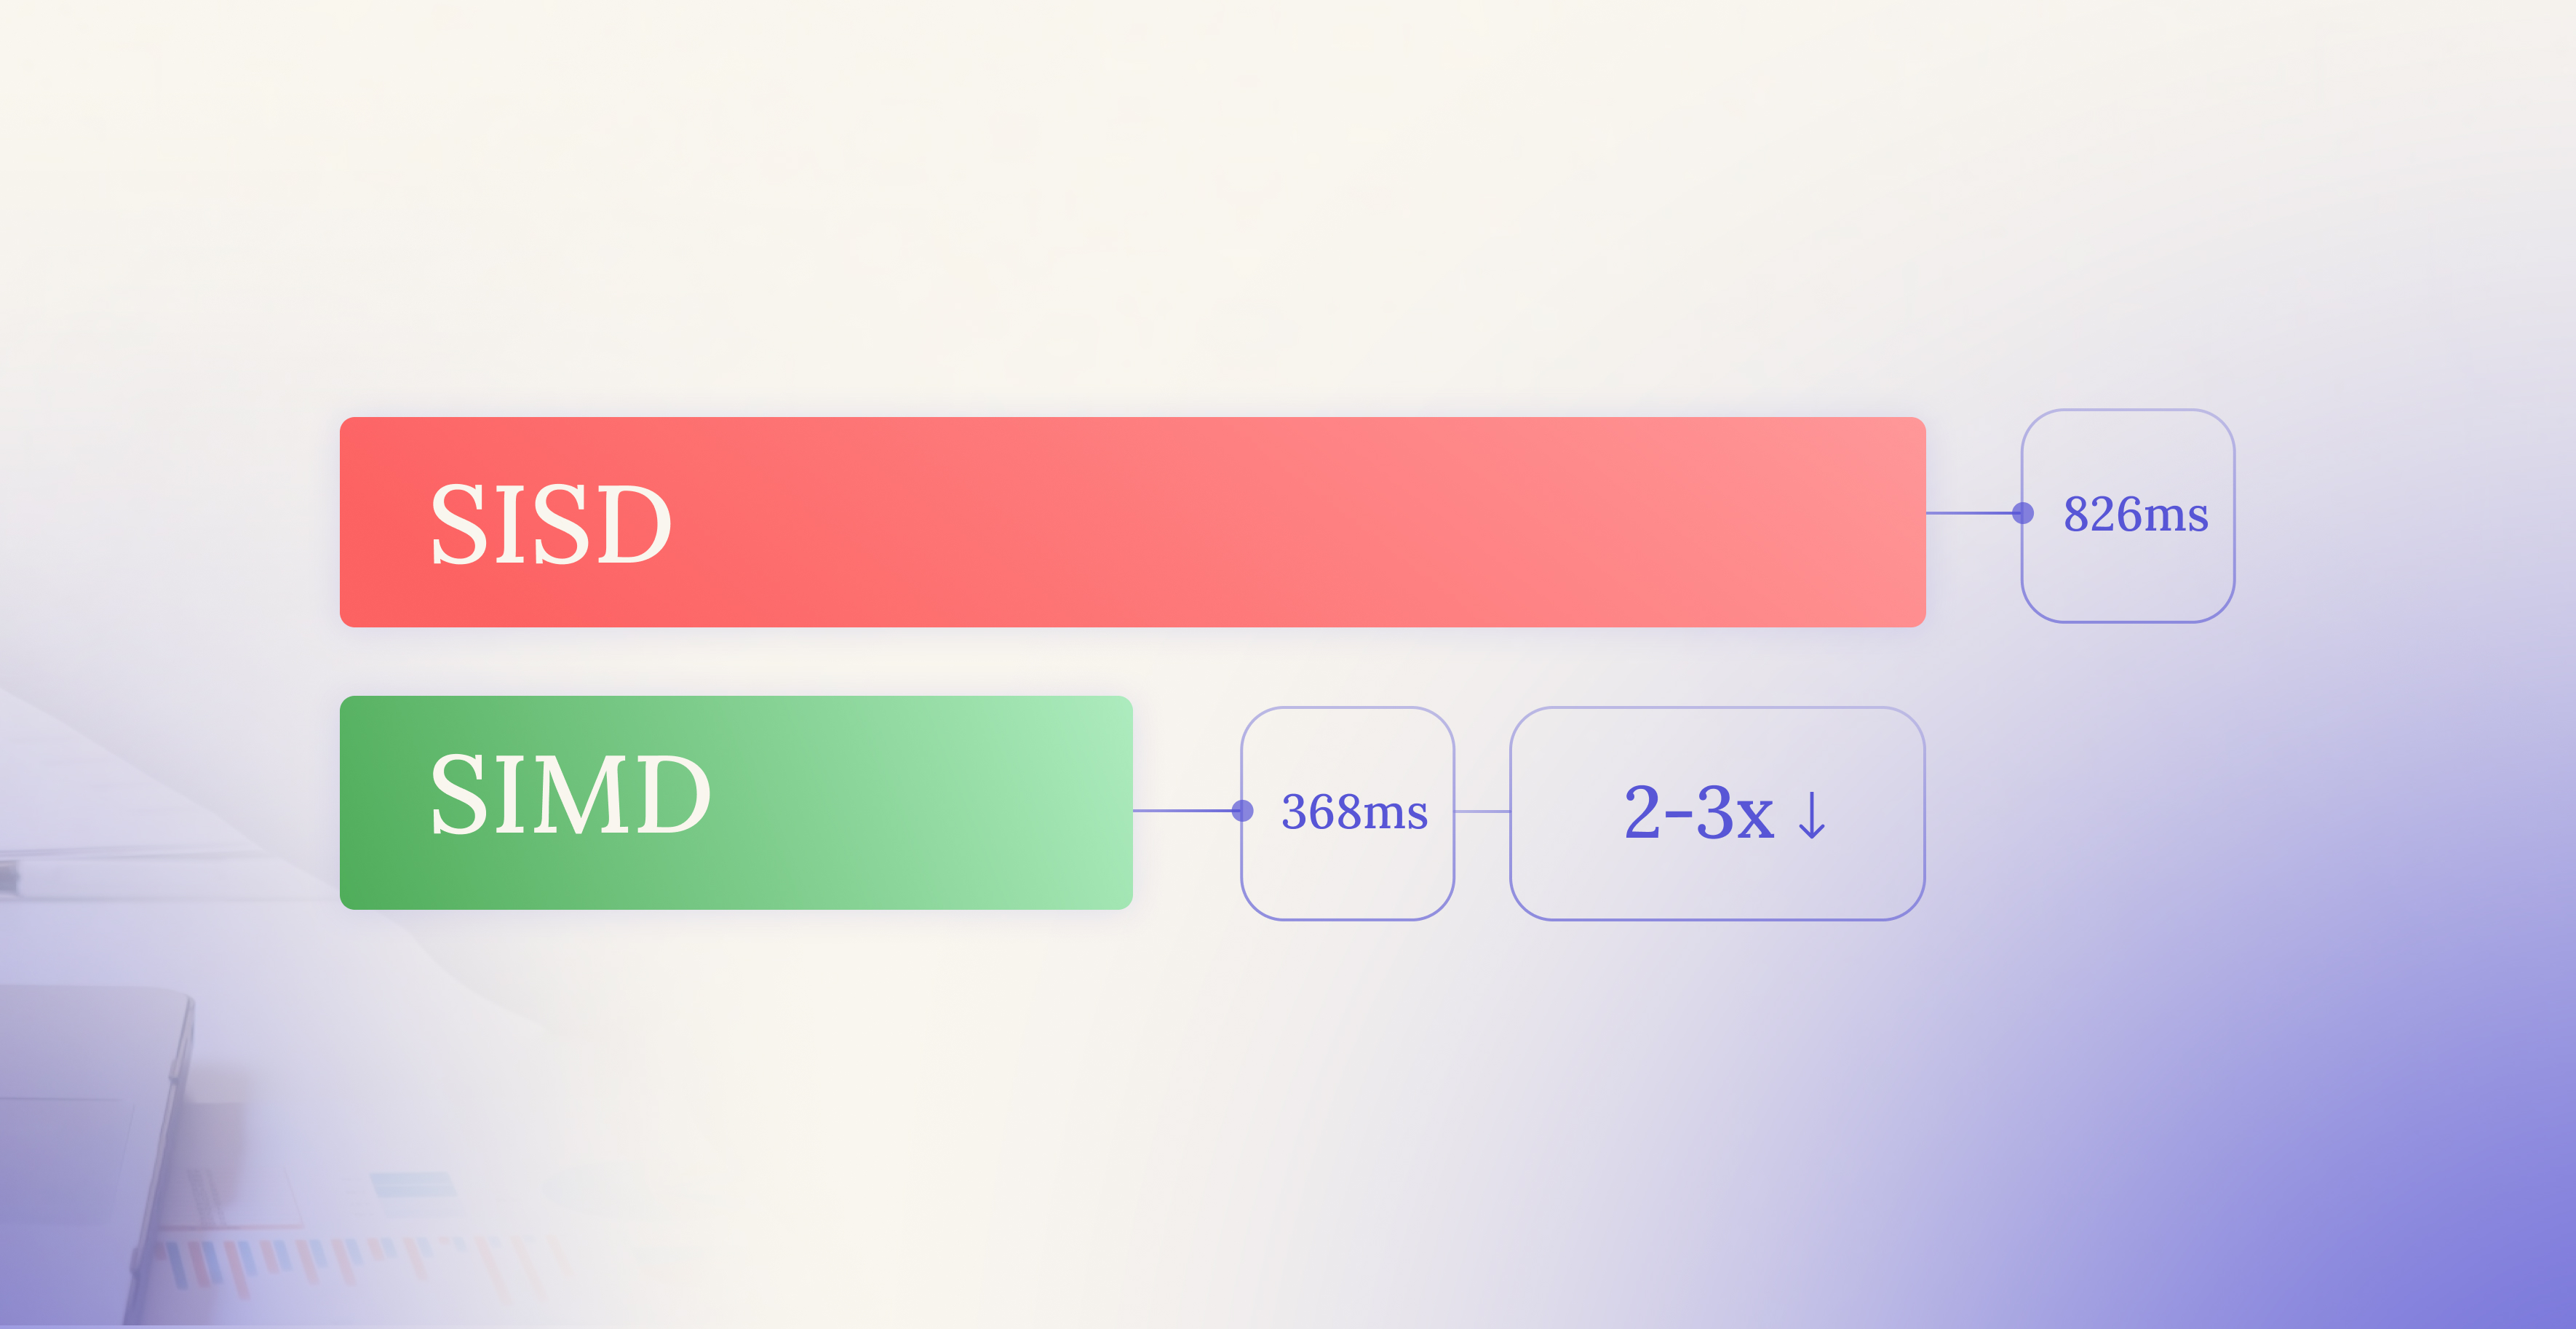
The core improvement lies in adopting a vectorized operations model, which enabled us to leverage the “single-instruction, multiple-data” (SIMD) capability of modern CPUs.
Instead of calculating one floating-point value at a time, the system now processes multiple values simultaneously using CPU-level parallelization.
Conceptually, imagine adding two timeseries together.
The traditional approach:
- Fetch value A at index 0
- Fetch value B at index 0
- Add
- Store result
- Repeat for index 1, 2, 3, and so on
The vectorized approach:
- Load a block of values from series A
- Load a block of values from series B
- Perform addition across the entire block in one operation
- Store the resulting block
By leveraging vector operations, the processor executes calculations in bulk rather than sequentially.
To enable this, a large portion of the metrics logic had to be refactored. Roughly 70% of the metrics were rewritten from loop-based implementations into vector-based logic structures. Instead of patching individual datapoints and building time series iteratively, calculations now operate on array blocks at once.
This is not a superficial optimization. It is a structural shift in how analytics are computed.
Measurable Performance Gains
The results speak for themselves.
On very large metric requests, execution times improved by approximately 2-3x.
Where certain heavy requests previously averaged around 800-900 milliseconds, they now execute in the 300-400 millisecond range. More importantly, response times now consistently stay below 500 milliseconds, with 90% of requests averaging below 45 milliseconds, reducing outliers and improving predictability.
The impact is not just about lower averages. It is about consistency. In advisory workflows, reliability matters more than peak performance. Advisors need dashboards to load quickly every time, not just most of the time.
Vectorized processing increases throughput and reduces variance in response times. That consistency is what users experience.
What This Means for Wealth Managers
Most advisors are not concerned with CPU instruction sets. They care about responsiveness, stability, and the ability to handle growth.
Here is how this architectural improvement translates into day-to-day value.
1. Faster Client Interactions
In client meetings, analytics often need to be recalculated on the fly:
- Changing time periods
- Comparing benchmarks
- Reviewing attribution
- Adjusting allocation assumptions
When metrics respond instantly, conversations flow naturally. Advisors can explore scenarios without hesitation. Technology becomes an enabler rather than a constraint.
2. Better Handling of Large Portfolios
As firms grow, portfolios become more complex. Multi-entity structures, aggregated reporting, and cross-portfolio comparisons place heavier demands on analytics engines.
A vectorized metrics engine processes large datasets more efficiently, making it better suited for firms with substantial assets under management or complex portfolio structures.
3. Scalability Without Degradation
Sequential processing models degrade linearly with data growth. The larger the dataset, the slower the execution.
Vectorized processing reduces this effect by increasing computational throughput. This creates a more scalable foundation, capable of supporting expanding client bases and larger reporting needs without proportional performance decline.
What This Means for Technical Stakeholders
For CTOs and technical decision-makers, performance is not just a user experience feature. It is an architectural signal.
Vectorized computation indicates that the system is:
- Designed with computational efficiency in mind
- Optimized at the algorithmic level, not only at the interface layer
- Prepared for higher data volumes and more advanced analytics
Refactoring metrics into vector operations is non-trivial. It requires careful attention to:
- Numerical precision
- Stability across edge cases
- Memory management
- Consistency across all metric types
It is a deliberate engineering investment that strengthens the long-term foundation of the analytics engine.
For firms evaluating portfolio management systems, this matters. As reporting demands increase and analytics expectations rise, underlying computational efficiency becomes a differentiator.
Engineering for the Long Term
The shift to SIMD execution is not about shaving off a few milliseconds. It is about ensuring that portfolio analytics remains robust as client demands increase.
With 2-3x faster execution on large metric requests and consistently sub-500 millisecond response times, the metrics engine is now materially more efficient and scalable.
For advisors, that means smoother workflows.
For firms, it means infrastructure ready for growth.
And for technical stakeholders, it demonstrates an analytics architecture designed to perform under real-world complexity.